The Load Nobody Watches
Most energy optimization focuses on peak hours. That is where the money is, after all. But there is a second number that quietly drives a large share of your annual cost: baseload.
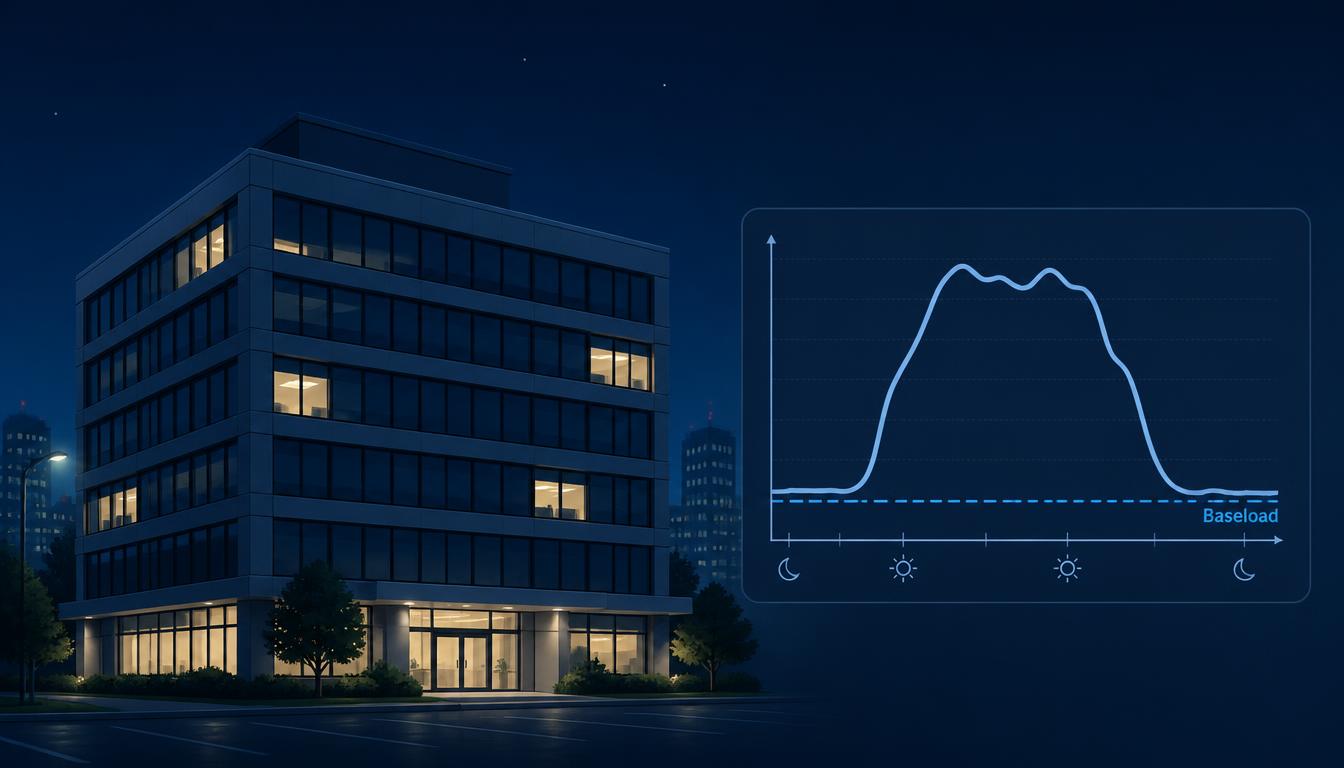
Baseload is the consumption that exists even when the building is empty. At 3 AM, when no one is in the building, the meter is still running. Parking lights. Standby equipment. Systems nobody turned off.
If you don’t know your building’s 3 AM load, you don’t know your baseload. And if you don’t know your baseload, you have a consumption leak nobody is chasing.
The data is uncomfortable: baseload is, on average, about 70% of total energy use in commercial buildings. Most buildings use more energy when closed than when open. And over 95% of the variation in annual usage across buildings can be explained by just one number — baseload.
Why Baseload Matters
| Factor | Impact |
|---|---|
| Hours per year | A building operates ~8,760 hours. Occupied hours are typically 2,500–3,000. |
| Baseload share | Often 20–70% of total consumption |
| Cost visibility | Baseload is invisible on monthly invoices |
| Fix difficulty | Usually simple — a control logic issue, not a hardware issue |
The math is uncomfortable: if your baseload is 30% of consumption and you could cut it by half, you would reduce total consumption by 15% — often with no capital investment.
For commercial buildings, baseload typically ranges from 5 to 50+ kW due to server rooms, security systems, ventilation, and emergency lighting. Accurately identifying this floor is the first step toward reducing it.
The Baseload Analysis Checklist
Step 1: Measure the 3 AM Load
Pick three non-working days. Record the meter reading at 3 AM. This is your baseload, at least for that period.
What you need: Access to meter data (BMS, EMS, or utility portal).
Method note: Utility bill analysis uses 12 months of billing data to identify the lowest monthly consumption, then divides by hours in that billing period to approximate baseload in kW. This is simple but masks daily variation. Smart meter interval data (15-minute or hourly readings) reveals the actual minimum demand over each 24-hour period.
Step 2: Break It Down by System
You cannot reduce what you cannot attribute. Break the baseload into categories:
| Category | Typical Share of Baseload |
|---|---|
| Lighting (parking, corridors, facade) | 20–35% |
| HVAC (standby, unoccupied conditioning) | 25–40% |
| IT and comms rooms | 10–20% |
| Elevators, pumps, misc. | 10–20% |
| Unknown | The problem |
The “Unknown” category is where the savings hide.
Step 3: Walk the Building at Night
Nothing replaces a physical walkthrough. At 10 PM or 3 AM, walk the building. What is on that shouldn’t be?
Common findings from ENERGY STAR assessments include: lights left on in unoccupied spaces (common areas, storage rooms, restrooms, break rooms, outdoor areas); equipment left on overnight including those in sleep or idle mode; and HVAC systems running through unoccupied hours.
Step 4: Check the Control Logic
For each item found in Step 3, ask: why is this on?
| Question | If the answer is… | Then… |
|---|---|---|
| Is there a schedule? | No | Add one |
| Is the schedule correct? | No | Fix it |
| Is the schedule overridden? | Yes | Find out why |
| Is it a manual system? | Yes | Consider automation |
A critical first check: review your BMS or BAS code to ensure that specific commands to reduce unneeded energy consumption — such as on/off times — have not been overwritten.
Step 5: Quantify the Opportunity
For each fixable item, estimate the savings:
Savings = (Current baseload of item) × (Hours per year) × (Energy rate)
This number is what justifies the fix.
Common Baseload Culprits
| Culprit | Typical Fix | Effort |
|---|---|---|
| Parking lighting | Occupancy or schedule control | Low |
| Corridor lighting | Schedule + dimming | Low |
| Empty-floor HVAC | Zone-level scheduling | Medium |
| Standby equipment | Timer or smart plug | Low |
| Legacy systems | Audit and decommission | Medium |
Most buildings can cut 10–30% of energy use with scheduling fixes, lighting and HVAC control tuning, and basic maintenance, all without sacrificing comfort.
Why This Is the Fastest Return
Baseload reduction is often the highest-ROI energy project available, for one reason: it usually requires no new hardware.
The sensors, meters, and controllers are already installed. What is missing is the control logic — a schedule, a rule, an override that nobody wrote. Writing that logic costs engineering hours, not equipment.
A single parking lighting schedule can reduce total building consumption by 5–7%. Multiply that across a portfolio, and the number becomes significant.
Action Step
This week, find out your building’s 3 AM load. If you can’t find it, that is your first finding: you don’t have visibility into your baseload. Fix that before anything else.
📚 Sources
- SEAI Energy Audit Handbook — Baseload analysis, regression methods, and typical baseload temperatures for office buildings (15.5°C).
- Gridium — Baseload as the dominant factor in commercial building energy use.
- SurgePV — Base load estimation methods, typical ranges for commercial buildings, and data source comparison.
- ENERGY STAR Treasure Map for Commercial Buildings — Practical checklist for identifying baseload energy waste.
- ABM Perspectives — Quick-win checklist for reducing energy use in commercial facilities.